
2016 Indiana Forest Products Price Report and Trend Analysis
By Jeff Settle, Chris Gonso, and Mike Seidl
Survey Procedures and Response
Data are collected twice a year, but log prices change constantly. Standard appraisal techniques by those familiar with local market conditions should be used to obtain estimates of current market values for stands of timber or lots of logs. Please note, because of the small number of mills reporting logging costs, “stumpage prices” estimated by deducting the average logging and hauling costs from delivered log prices must be interpreted with extreme caution and is meant to only serve as a guide. Actual stumpage values you may be offered depend on many variables such as access, terrain, time of year, etc.
Data for this survey were obtained by a direct mail/electronic survey to sawmills, veneer mills, concentration yards, and independent log buyers. Only firms operating in Indiana were included. The survey was conducted and analyzed by the Indiana DNR Division of Forestry. The prices reported are for logs delivered to the log yards of the reporting mills or concentration yards. Thus, prices reported may include logs shipped in from other states (e.g., black cherry veneer logs from Pennsylvania and New York).
The survey was mailed to 22 firms and emailed to 31 firms. It is estimated these companies produce close to 90% of the state’s roundwood production. Electronic reminders, follow-up phone calls and additional mailings encouraged responses. Eighteen firms reported some useful data. Five mills reported producing 1 million board feet (MMBF) or more. Two mills reported production of 5 MMBF or greater. Total production reported for 2015 was 42 MMBF compared to 64 MMBF for 2014, and 147 MMBF for 2013. The largest single mill production reported was 21 MMBF. These annual levels are not comparable since they do not represent a statistical estimate of total production.
The price statistics by species and grade don’t include data from small custom mills, because most do not purchase logs, or they pay a fixed price for all species and grades of pallet-grade logs. They are, however, the primary source of data on the cost of custom sawing and pallet logs. The custom sawing costs reported do not reflect the operating cost of large mills.
This report can be used as an indication of price trends for logs of defined species and qualities. It should not be used for the appraisal of logs or standing timber (stumpage). Stumpage price averages are reported by the Indiana Association of Consulting Foresters in the Indiana Woodland Steward, http://www.inwoodlands.org/.
Delivered Sawlog Prices
The number of mills reporting delivered sawlog prices remained fairly constant to those who reported in the 2015 winter report (Table 1). Sawlog prices for the premium species (specifically black walnut and white oak) were down slightly from the 2015 winter report. From an overall standpoint, prices were up for most of the other species. Generally soft maple markets are better than all other species. While not what they were a year ago, white oak and walnut markets are steady. Red oak demand is sluggish. Markets are trending down for poplar, hickory and ash.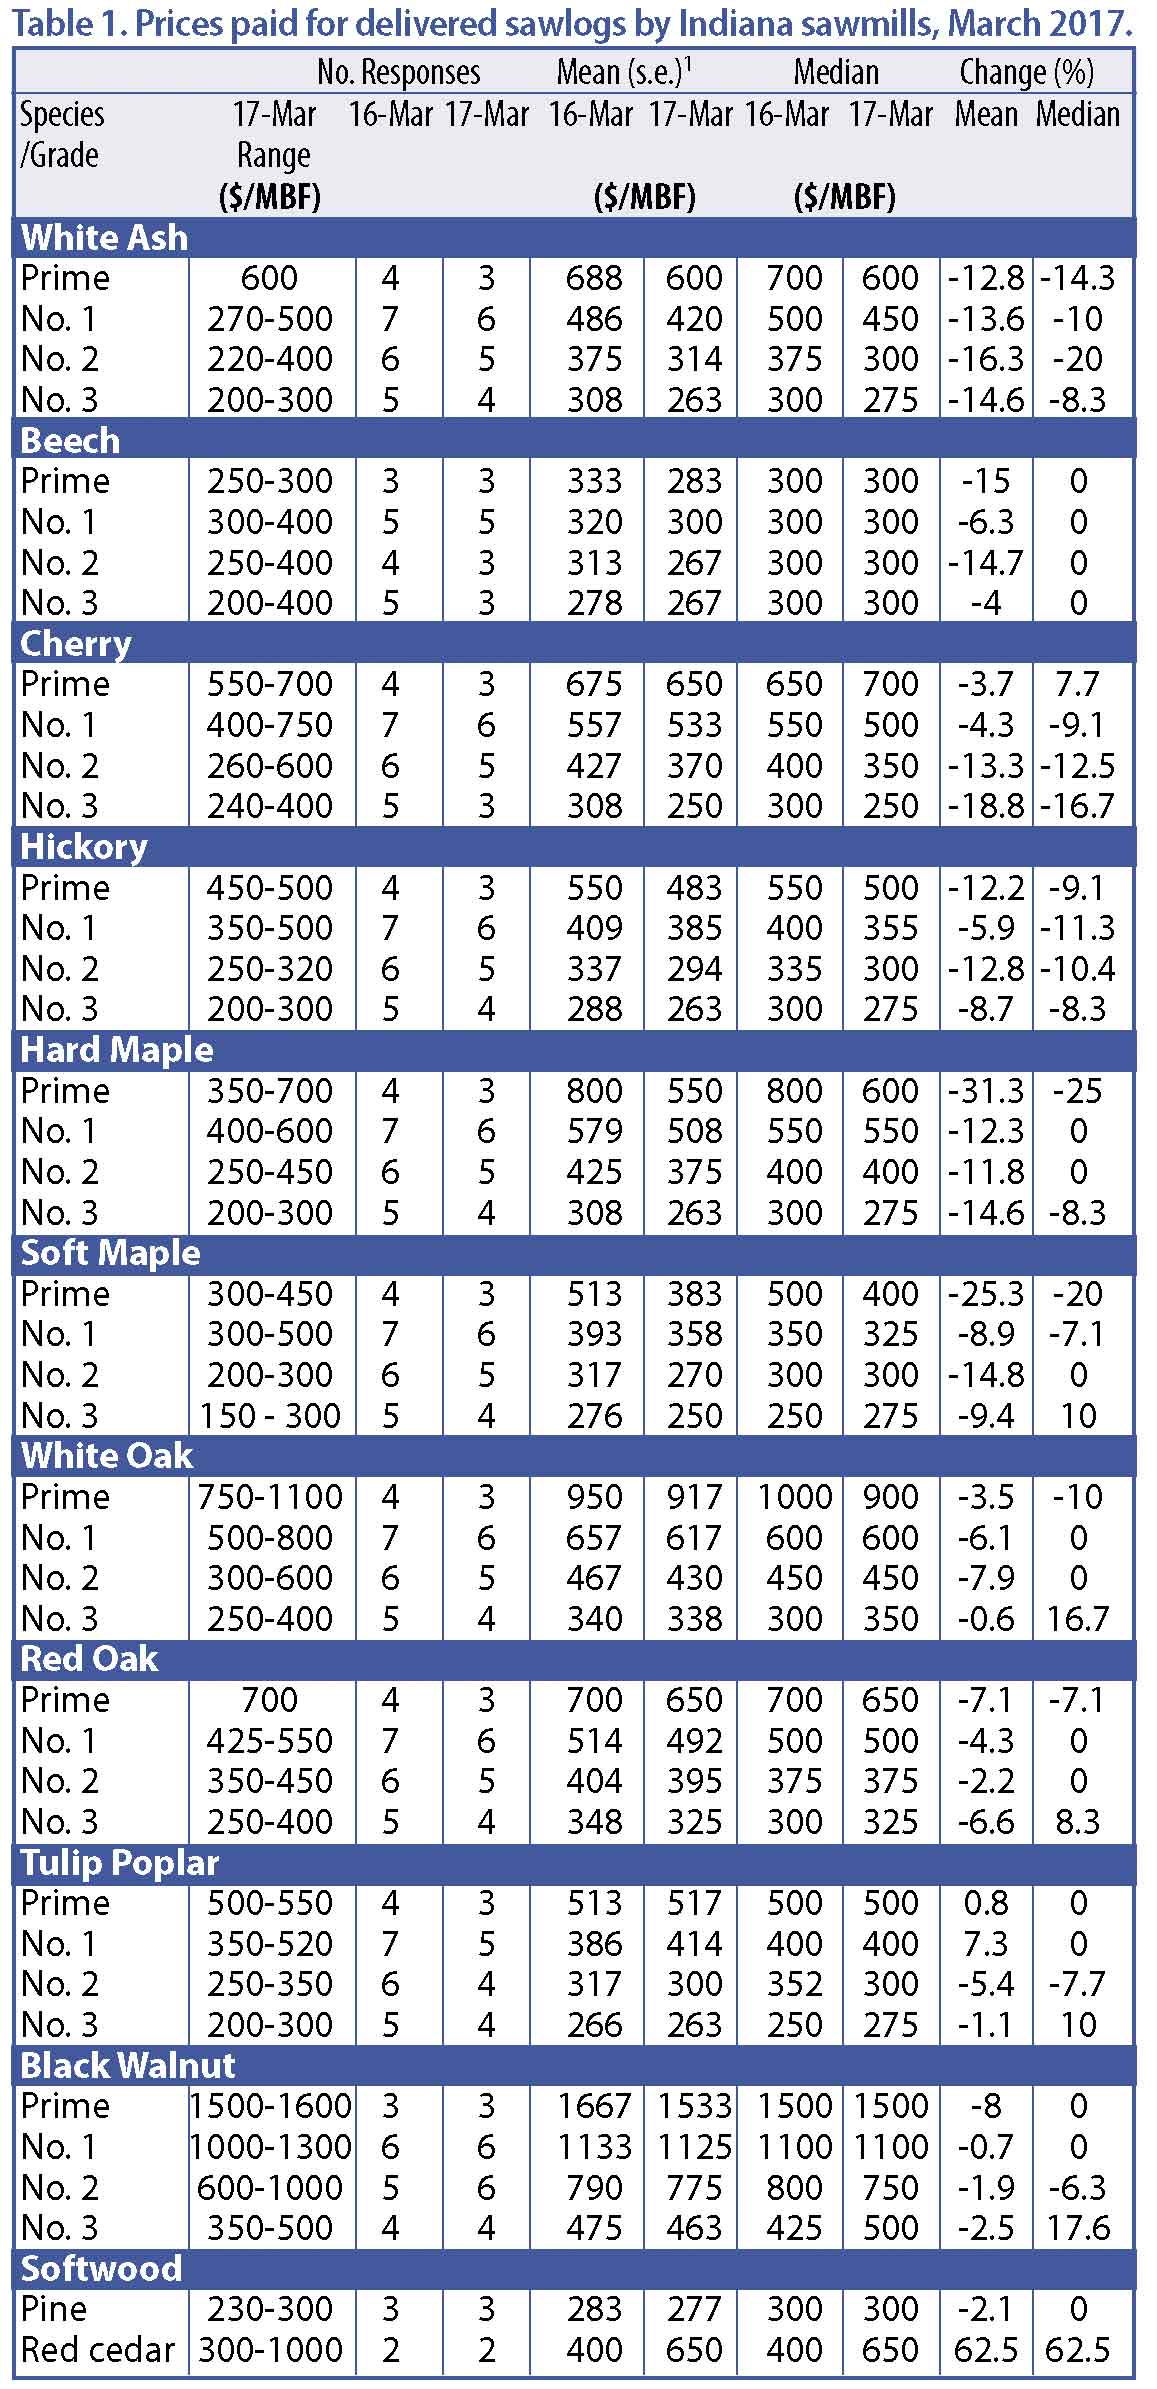
Premium Species
With the exception of prime grade (up 15%), the remaining three grades of white oak sawlogs were slightly lower (-2.3%). The demand for stave logs has slowed for the time being, and this has put more white logs on the sawlog market. With the markets being so strong for veneer, stave and rift/quartered logs, finding larger, quality logs has become quite a challenge. In a complete reversal from the 2015 winter report, prices being paid for red oak were up across all grades, with prime leading the way at 14% higher.
Demand for black walnut sawlogs had slowed down when the 2015 winter report was completed, and that trend continues. Prices were down across all log grades with Nos. 2 and 3 both at almost 18%.
Black cherry sawlog prices have not changed much since the 2015 winter report. Prime logs were off almost 4%, while No.1 and No. 2 prices were just slightly higher, and No. 3 log prices were off less than 1%. Consumer demand for the darker-finished wood continues to hurt the cherry markets.
Hard maple sawlog prices were generally higher across the various grades. Prime logs were 14% higher and Nos.1 and 2 were just slightly higher than the 2015 winter report. No. 3 logs were the lone item that decreased (-5.2%). The summer and early fall months usually see less hard maple production due to the fear of stain. This may have played a large part in the price drops. Soft maple markets have been fairly steady due to strong lumber demand. Consumers are buying more painted wood materials, which play well into soft maple’s hands. Soft maple logs averaged just over 5% higher across grades.
Other Hardwood Species
More ash timber is being harvested in an effort to stay ahead of the Emerald Ash Borer. Production is high right now. Still, prime ash sawlog prices, at 17%, were significantly higher than those from the 2015 winter report. The remaining three grades were only a combined 1% higher than the 2015 winter report.
Tulip poplar decreased across all grades. Prime sawlogs were reported to be only 2.4% less than the 2015 winter report, while the remaining three grades combined for a 7.5% decrease.
Softwood Logs
The price of pine sawlogs increased 22% to $283/MBF. Red cedar prices were also up almost 21% from those in the 2015 winter report. It should be noted, however, that only three producers reported pine sawlog prices and two producers reported red cedar prices.
Veneer Log Prices
The number of mills reporting veneer log prices decreased slightly from the 2015 winter report (Table 2). Prices were reported by both veneer mills and sawmills. Sawmills resell their veneer-quality logs to veneer mills, exporters, overseas importers and manufacturers. On occasion, sawmills may produce specialty cuts like quarter sawing marginal veneer logs. The variation in veneer log pricing is due to mix veneer mills, sawmills and loggers reporting their values. This difference in values could be reduced if prices were only from veneer manufacturers.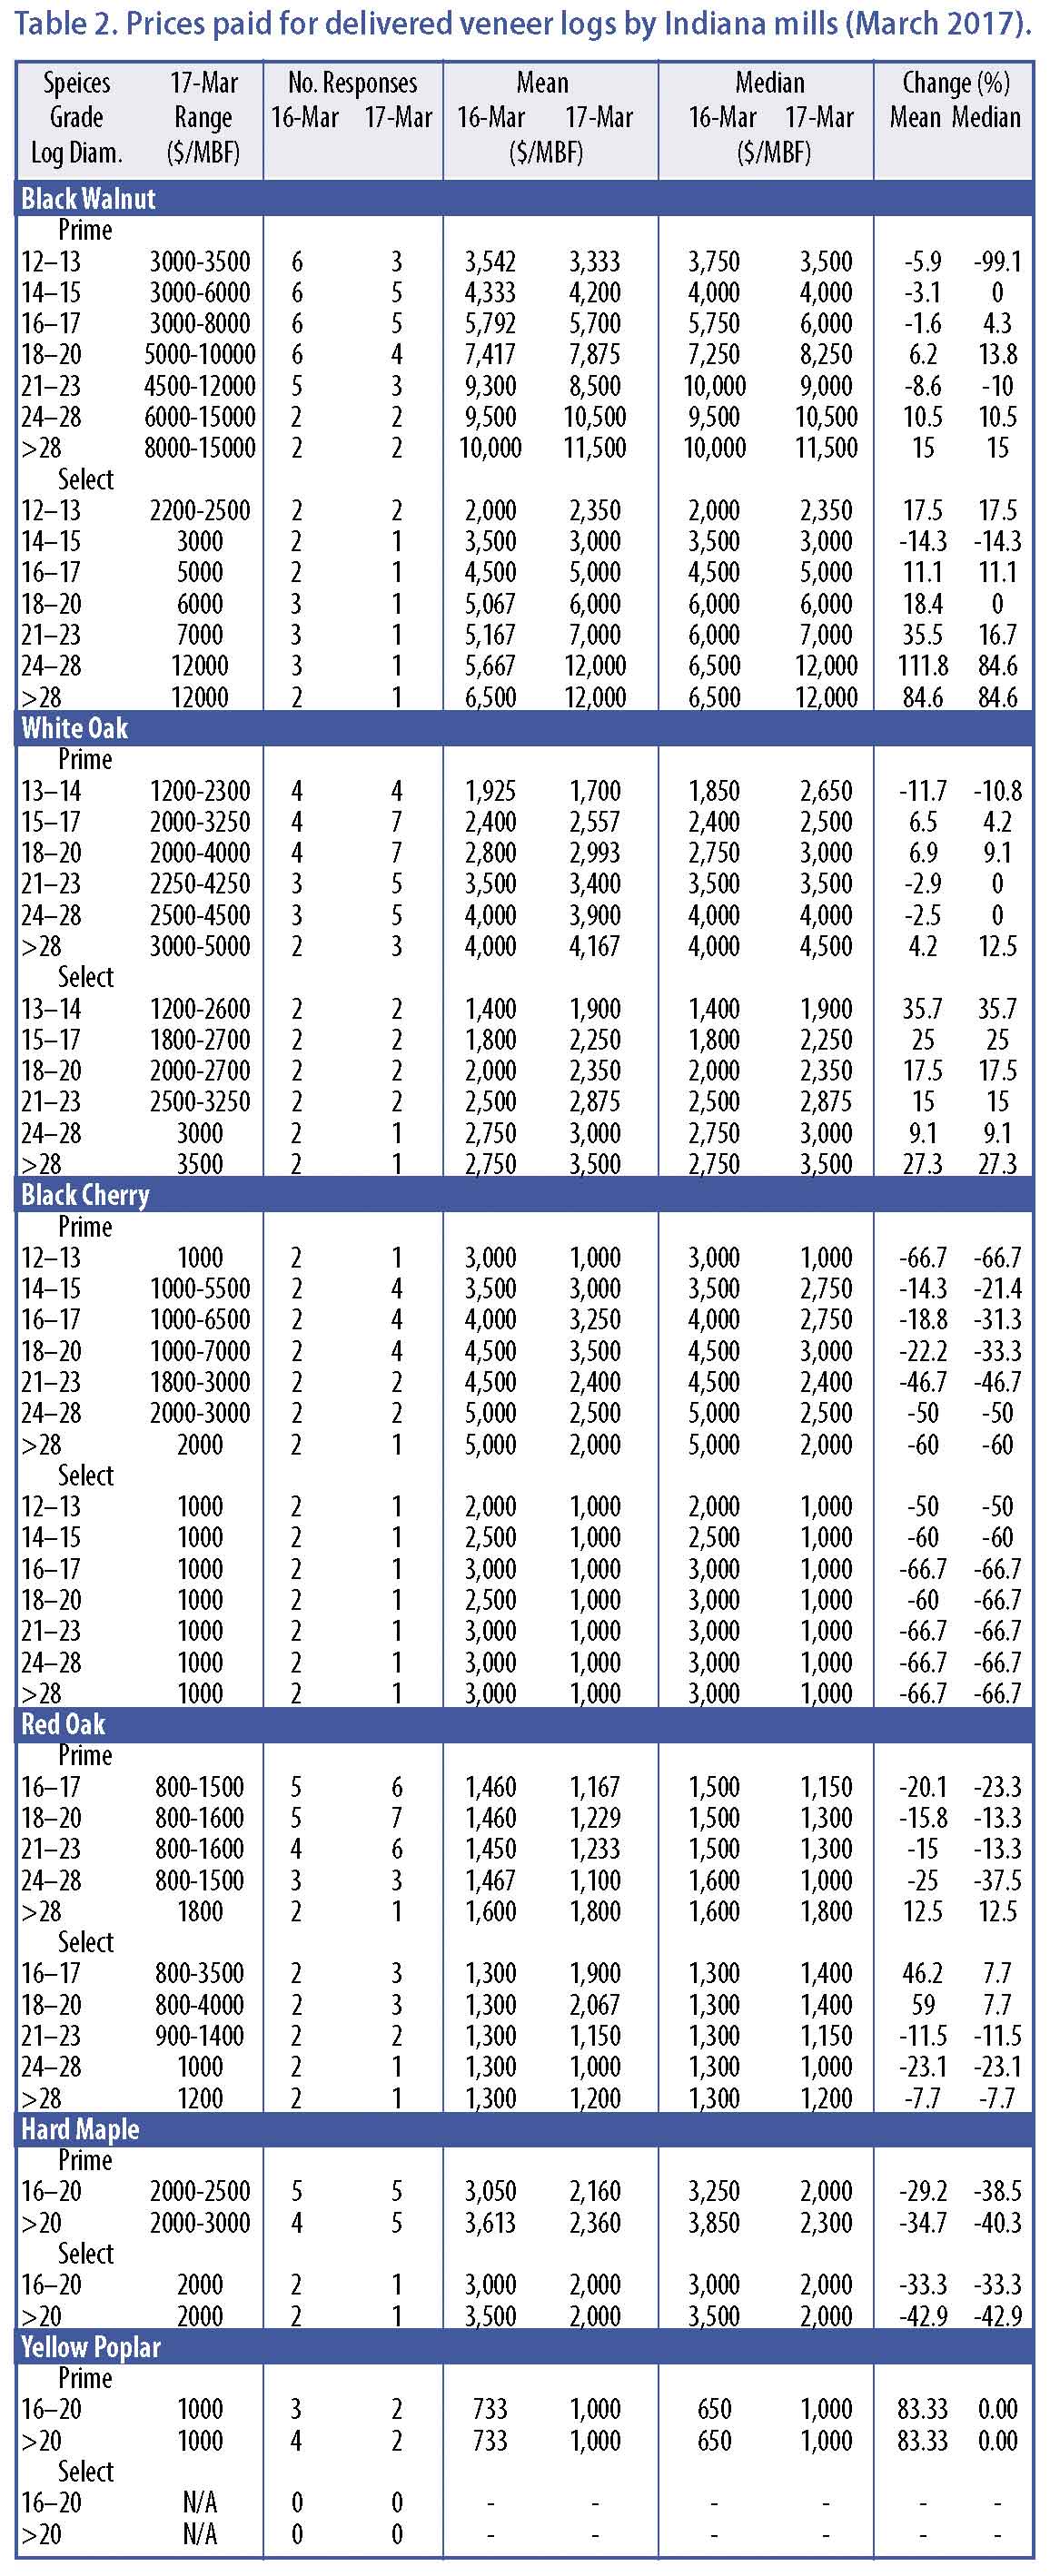
Demand was reported to be slower in the winter report. That demand has picked up slightly since the first of 2016, with most mills running at 70%-80% capacity. Conversely, veneer-quality logs continue to remain in demand, and overall pricing is higher than what was reported in the 2015 winter report. Additionally, weather conditions, like the economic environment, can play havoc on log pricing and volumes available.
Black walnut and white oak veneer remain in demand both domestically and internationally. Black walnut veneer log prices were generally higher, especially prime in the 12” small-end diameter all the way up to 23” small-end diameter, which are averaging almost 9% higher. Pricing for 24” and larger prime veneer logs averaged 3.5% less. Select walnut veneer logs averaged almost 6% higher across the various diameters.
White oak prime veneer log pricing was up significantly from the 2015 winter report, averaging an increase of over 11%, while select veneer logs were up 12% across all diameters. With stave log supply/demand ratio in better balance, there should be more logs available on the market.
Red oak prime veneer log prices were down an average of 19%, and select veneer log prices were down an average of 5%.
Veneer mills reported significantly lower prices for hard maple. Prime veneer hard maple logs were off an average of almost 16%, while select veneer logs were down an average of 20%. Additionally, a slower economic condition throughout the international markets also increased the pressure on export log value.
These economic conditions will also affect white oak veneer, but to a much smaller degree. White oak markets are improved due to the stave market cooling off in recent months. There is still good demand though for rift and quarter-sawn white oak. When you add the demand for quarter-sawn and export lumber to the mix, the pressure for logs increases exponentially.
Custom Costs
Costs of custom services increased from the spring report in the areas of sawing and logging (per/MBF). The high cost of diesel fuel usually plays a large role in logging costs (Table 4). Logging costs as reported in this survey indicate an increase in logging costs from $160 to $253 per MBF.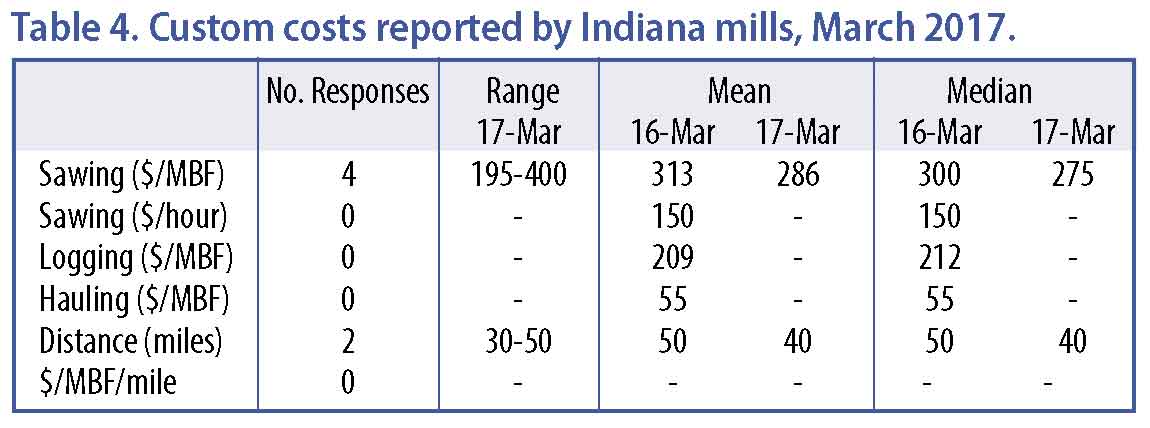
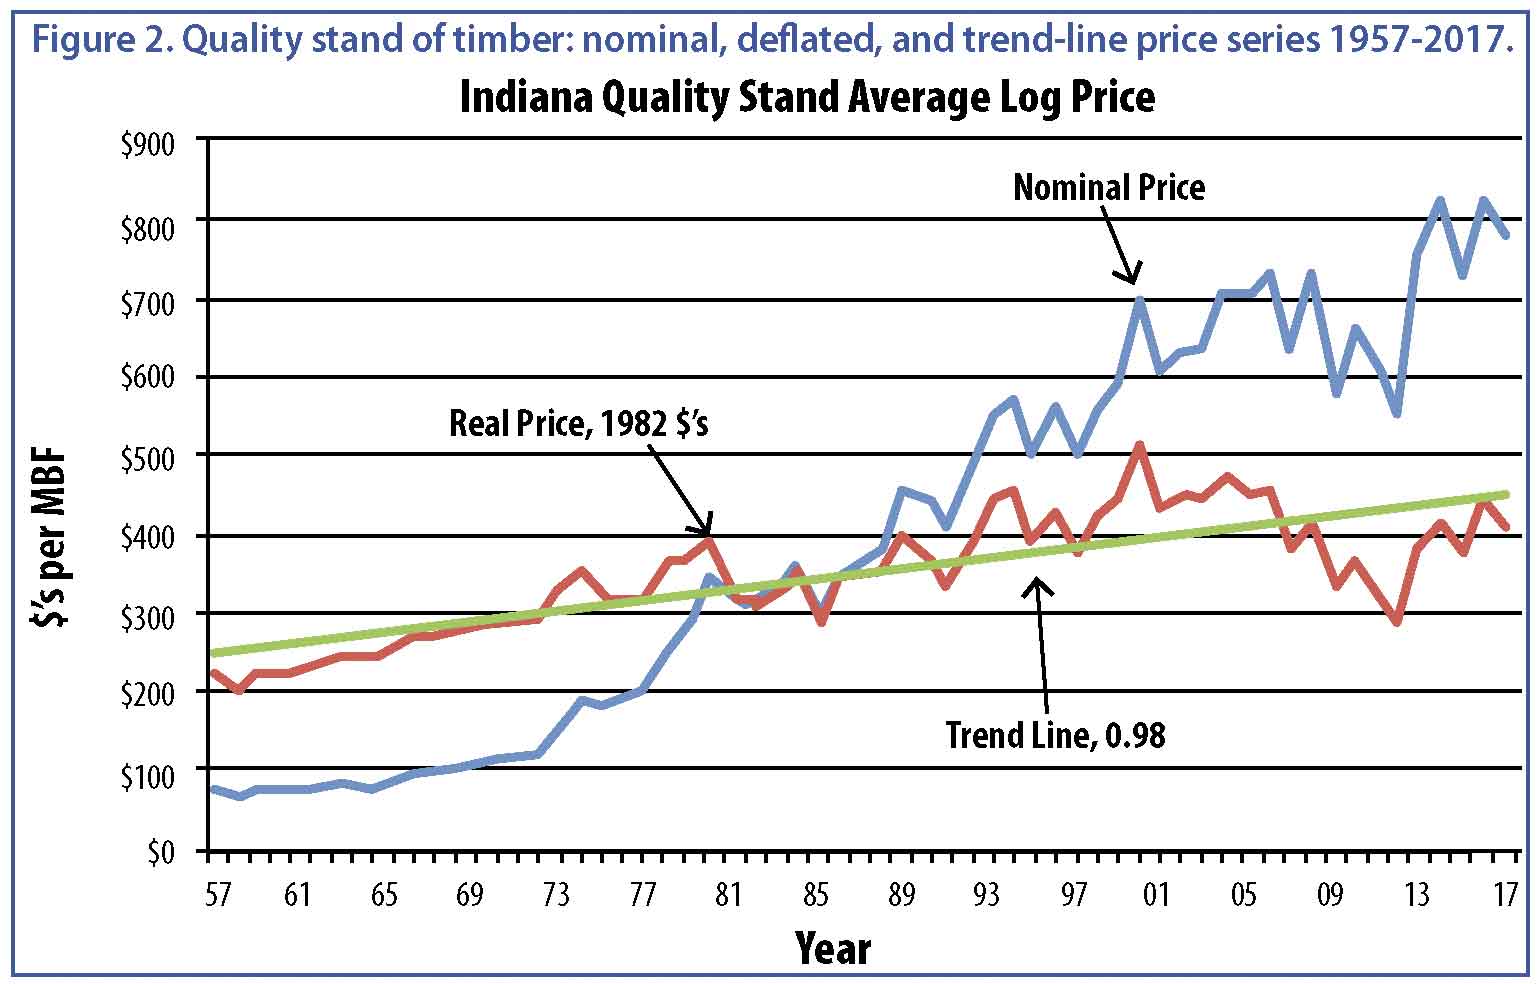
Indiana Timber Price Index
The delivered log prices collected in the Indiana Forest Products Price Survey are used to calculate the delivered log value of typical stands of timber. This provides trend-line information that can be used to monitor long-term prices for timber. The weights are based primarily on the 1967 Forest Survey of Indiana, with changes made to remove basswood, cottonwood, elm, black oak and sycamore in 2014.
The nominal (not deflated) price is a weighted average of the delivered log prices reported in the price survey. The price indexes are the series of nominal prices divided by the price in 1957, the base year, multiplied by 100. Thus, the index is the percentage of the 1957 price. For example, the average price in 2016 for the average stand was 938.1 percent of the 1957 price. The index for a quality stand increased from 1,007 percent to 1,146 percent.
The real prices are the nominal prices deflated by the producer price index for finished goods, with 1982 as the base year. The real price series represents the purchasing power of dollars based on a 1982 market basket of finished producer goods. It’s this real price trend that is important for evaluating long-term investments like timber and the log input cost of mills. Receiving a rate of return less than the inflation rate means that the timber owner is losing purchasing power, a negative real rate of return.
Note that each year the previous year’s number is recalculated using the producer price index for finished goods for the entire year. The price index used for the current year is the last one reported for the month when the analysis is conducted—March this year. The index decreased from 1.93 for 2015 to 1.83 as of March 2016. Inflation in the 1 to 2 percent range is generally considered a sign of a healthy, growing economy. The change from 2015 to 2016 is about 2 percent.
The nominal weighted average price for a stand of average quality increased from $535.1 in 2015 to $559.0 this year. Again, this series is based on delivered log prices, not stumpage prices. The deflated, or real, price increased from $277.7 in 2015 to $306.5 this year. The average annual compound rate of interest required to take the linear trend line from $201 in 1957 to $305 in 2016 is 0.71 percent (Figure 1).
The nominal weighted average price for a high-quality stand increased from $722.9 in 2015 to $822.7 this year. The average real price series for a high-quality stand increased from $375.1 in 2015 to $451.0 this year. The average annual compound rate of increase for the trend line is 1.02% per year (Figure 2).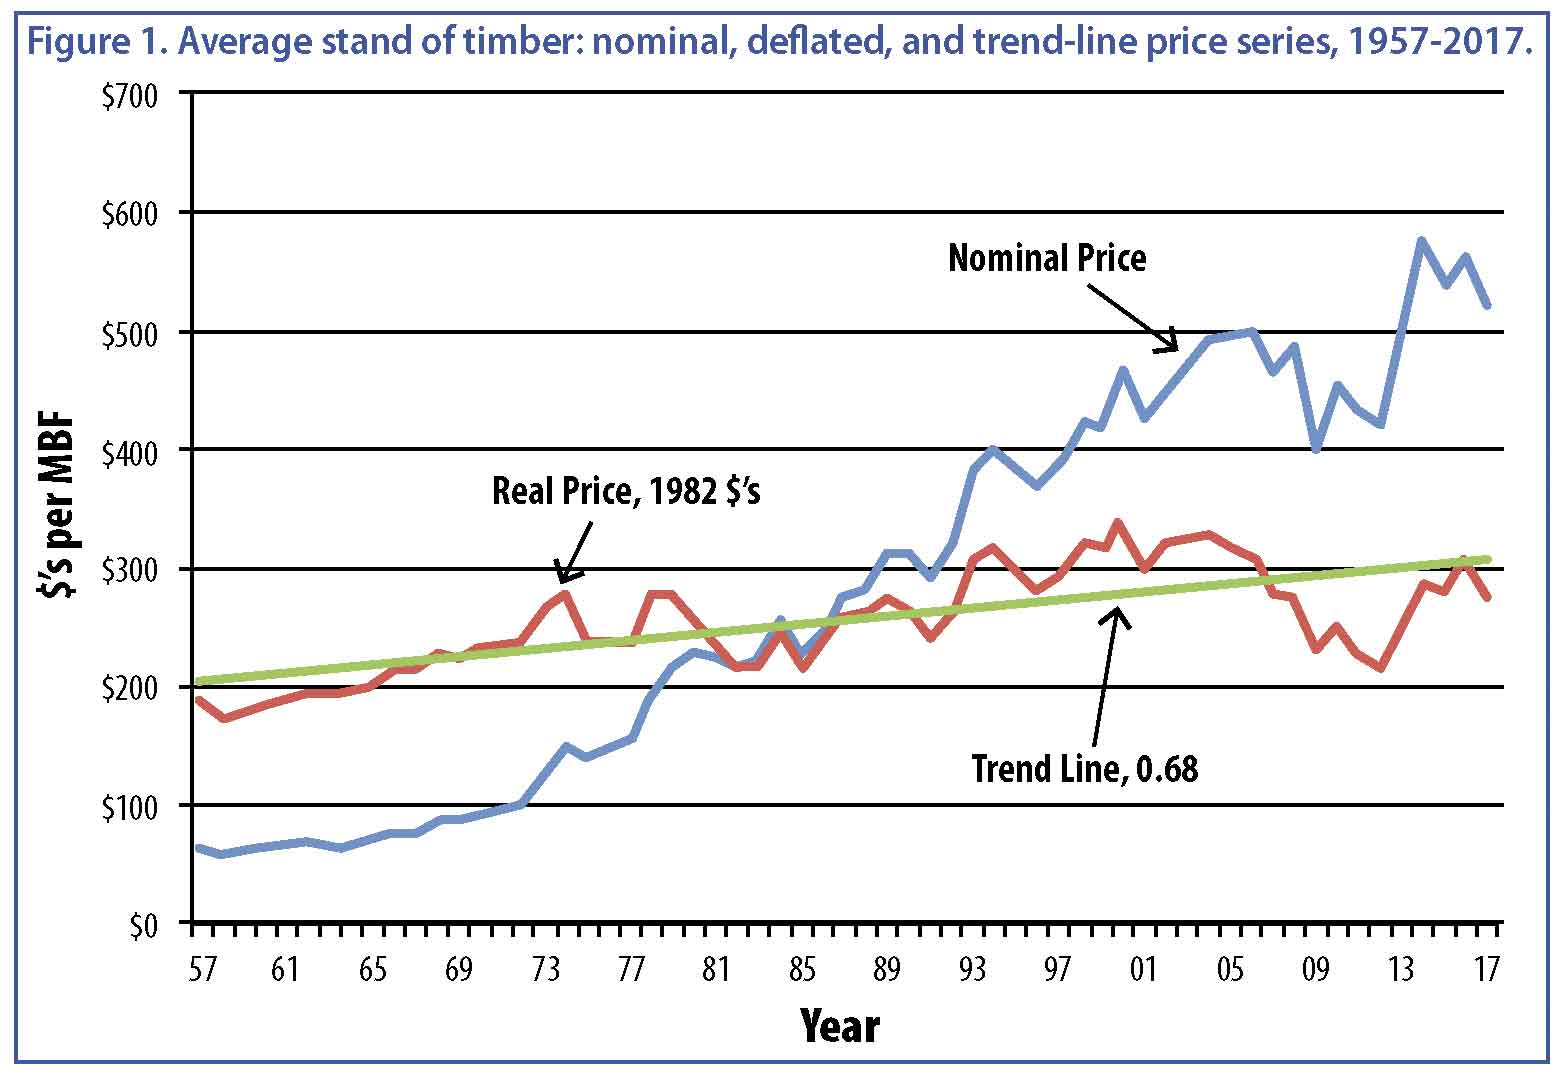
Implications
The extent to which holding a stand of timber increases purchasing power depends on when you take ownership and when you liquidate. The 60-year period used in this analysis is much longer than the typical length of ownership. The rate of increase in the trend line doesn’t include the return resulting from increase in volume per acre by physical growth, nor the potential increase in unit price as trees get larger in diameter and increase in quality. Maximizing these increases in value requires timber management.
The complete 2016 Indiana Forest Products Price Report and Trend Analysis can be read in its entirety at: http://www.in.gov/dnr/forestry/. Previous reports are available online through the Purdue University Library, www.lib.purdue.edu.
Jeffrey Settle, Forest Resource Information (FRI); Chris Gonso, Ecosystem Services Specialist for the Indiana Department of Natural Resources, Division of Forestry; and Mike Seidl, Hardwoods Program Manager for the Indiana State Department of Agriculture