
2017 Indiana Forest Products Price Report and Trend Analysis
Survey Procedures and Response
Data is collected twice a year, but log prices change constantly. Standard appraisal techniques by those familiar with local market conditions should be used to obtain estimates of current market values for stands of timber or lots of logs. Please note, because of the small number of mills reporting logging costs, “stumpage prices” estimated by deducting the average logging and hauling costs from delivered log prices must be interpreted with extreme caution and is meant to only serve as a guide. Actual stumpage values you may be offered depend on many variables such as access, terrain, time of year, etc.
Data for this survey was obtained by a direct mail survey to a variety of forest product industry including sawmills, veneer mills, concentration yards, and independent log buyers. Only firms operating in Indiana were included. The survey was conducted and analyzed by the Indiana Division of Forestry. The prices reported are for logs delivered to the log yards of the reporting mills or concentration yards. Thus, prices reported may include logs shipped in from other states (e.g. black cherry veneer logs from Pennsylvania and New York).
The survey was mailed to 21 firms and emailed to 32 firms. It is estimated these companies produce close to 90% of the state’s roundwood production. Electronic reminders, follow-up phone calls and additional mailings encouraged responses.
Seventeen firms reported some useful data. Eight mills reported producing 1 million board feet (MMBF) or more. Four mills reported production of 5 MMBF or greater. Total board foot production reported for 2016 was 70 MMBF compared to 42 MMBF for 2015, and 64 MMBF for 2014. The largest single mill production reported was 20 MMBF. These annual levels are not comparable since they do not represent a statistical estimate of total production.
The price statistics by species and grade don’t include data from small custom mills, because most do not purchase logs, or they pay a fixed price for all species and grades of pallet-grade logs. They are, however, the primary source of data on the cost of custom sawing and pallet logs. The custom sawing costs do not reflect the operating cost of large mills.
This report can be used as an indication of price trends for logs of defined species and qualities. It should not be used for the appraisal of logs or standing timber (stumpage). Stumpage price averages are reported by the Indiana Association of Consulting Foresters in the Indiana Woodland Steward, http://www.inwoodlands.org/.
Delivered Sawlog Prices
The number of mills reporting delivered sawlog prices (Table 1) was about 8% lower than those who reported in the 2016 spring report. Sawlog prices for the premium species (specifically black walnut and white oak) were down slightly from the 2016 spring report. Black walnut prices were down across all sawlog grades 3% while white oak sawlogs were down 4.5%. From an overall standpoint, prices were down for most every other species with ash, hard maple and soft maple taking the biggest hits. Tulip poplar log prices were very comparable to the spring 2016 data while red oak prices were 5% lower.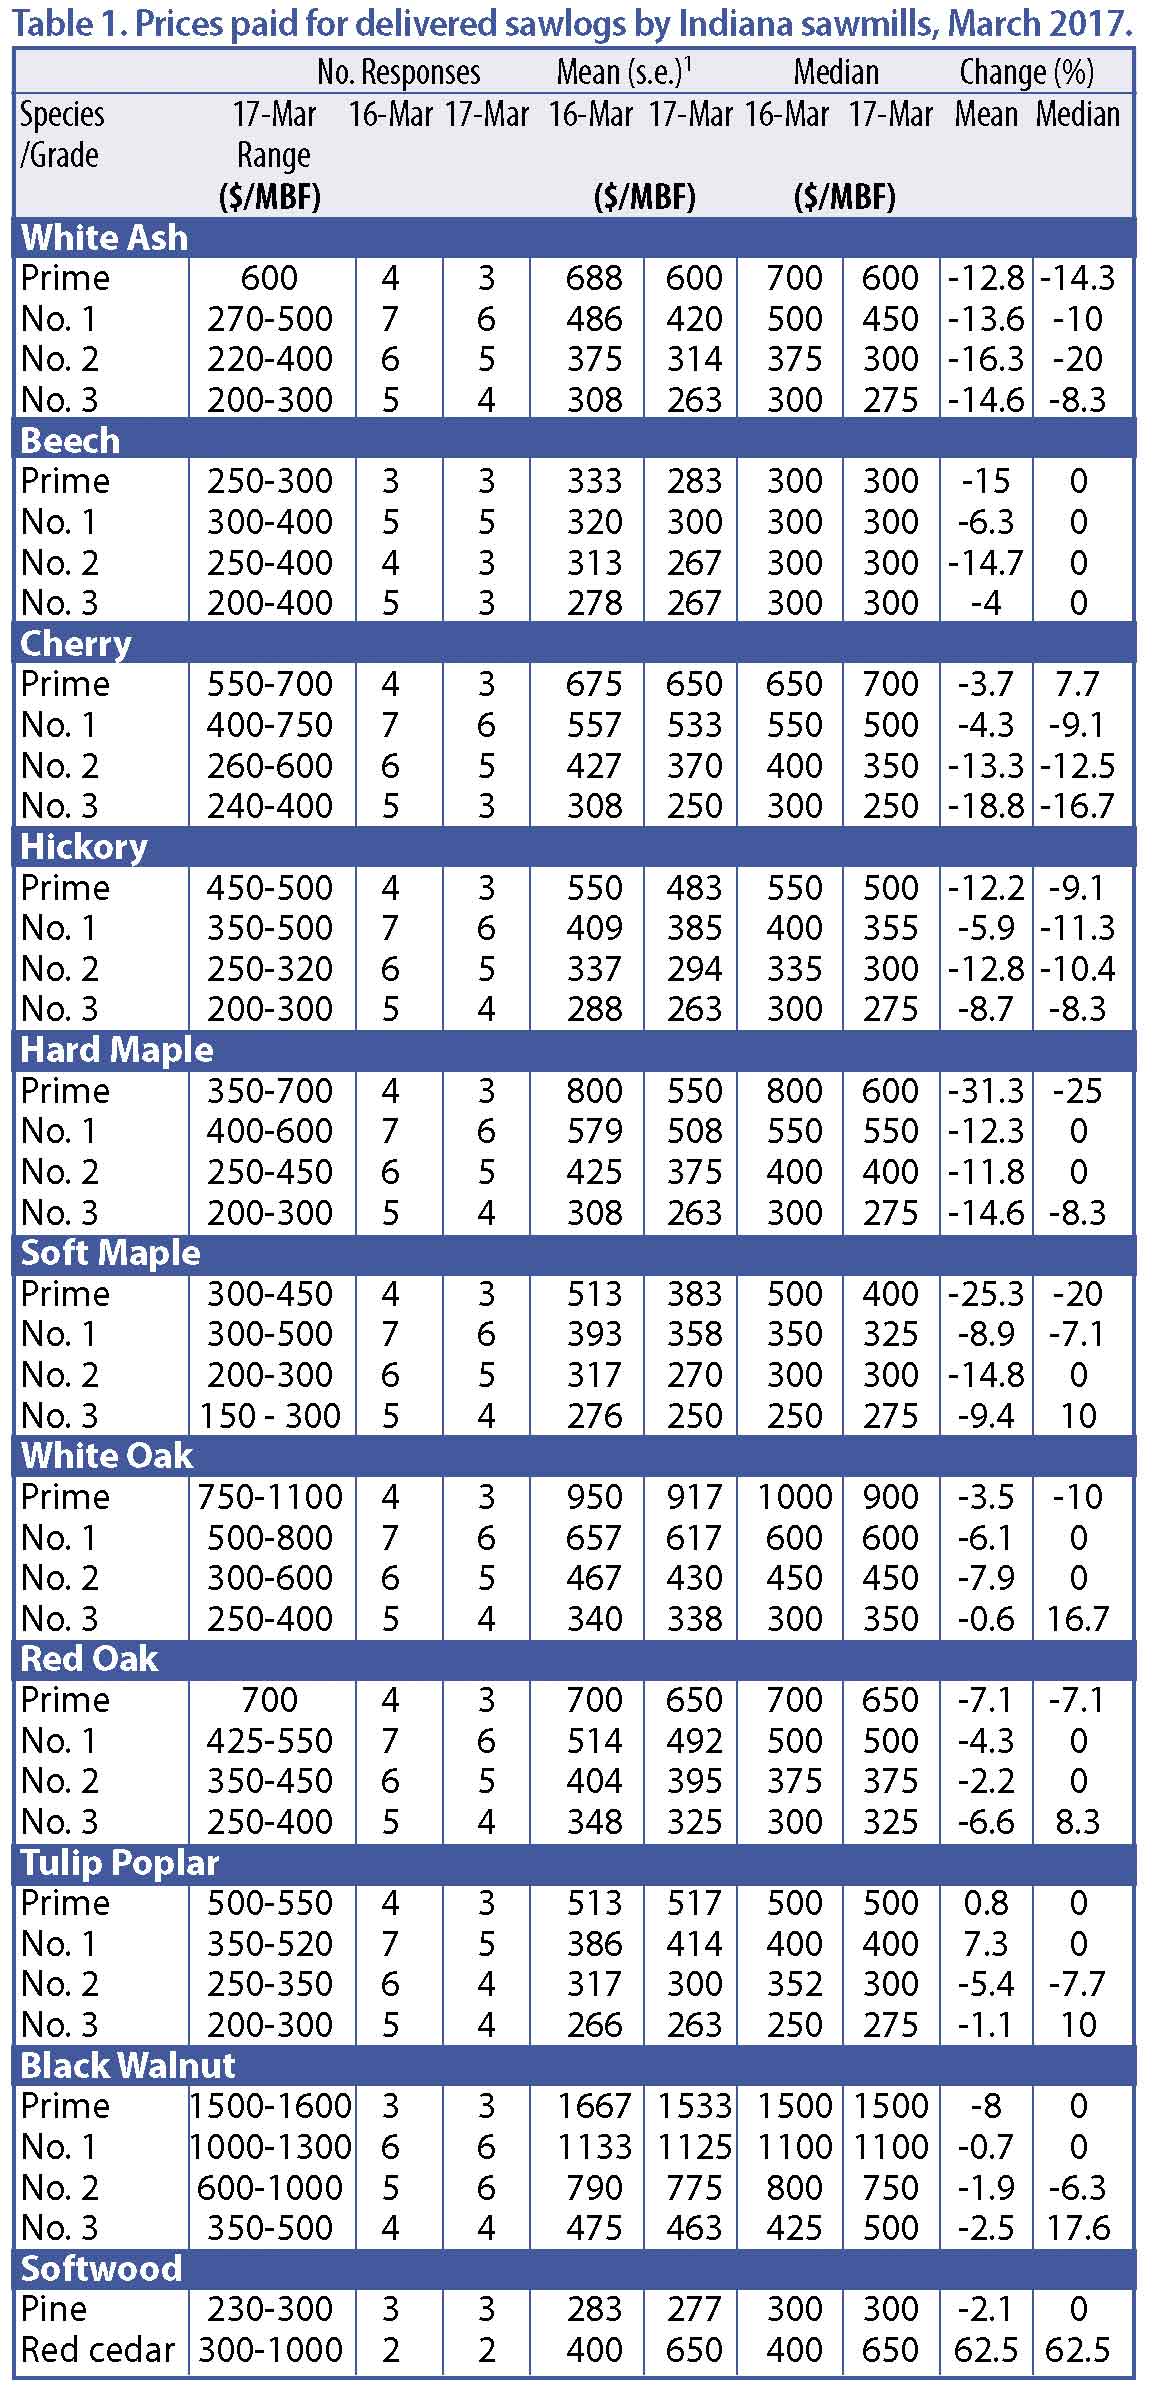
Premium Species
White oak sawlog prices were down across all grades. Prime sawlog prices were off 3.5%, grades 1-3 white oak sawlogs were down an average of almost 5%. Demand for stave logs while still good is not what it was a year ago.
Demand for black walnut sawlogs is steady. Overall walnut log pricing decreased 3% from the 2016 spring report. Prime logs showed the largest decrease of 8%.
Black cherry sawlog prices are down around 10% across all log grades although prime and grade 1 log prices were combined to be only about 4% lower while lower grade cherry logs were off an average of 15%. Consumer demand for the darker finished wood continues to hurt the cherry markets. However, there are reports of increased domestic demand for lumber and China continues to buy good volumes of lumber.
Hard maple sawlog prices were down across all grades with prime hard maple logs taking the brunt of the hit at 31%. Grade sawlog prices were off around 10%. Recent reports though point to increased interest in hard maple. The upcoming summer months are usually not a friend of hard maple due to sticker stain concerns. If demand for lumber continues to be good, this combined with seasonally lower production, log prices may see some increases.
Soft maple markets have lost a little luster compared to 2016. Overall, soft maple log prices were off 14% from the spring report. Similar to hard maple, mills may bump up production to be potential stain. Most feel that even with increased production, supply and demand will remain in good balance.
Other Hardwood Species
Landowners continue to have most of their ash marked for harvest to try and stay ahead of the Emerald Ash Borer. Although lumber prices are slightly higher, log prices have decreased just over 14% across all grades since the 2016 report. Tulip poplar was the only species NOT in the red but not by much. Overall log prices were less than 1% higher from the 2016 spring report.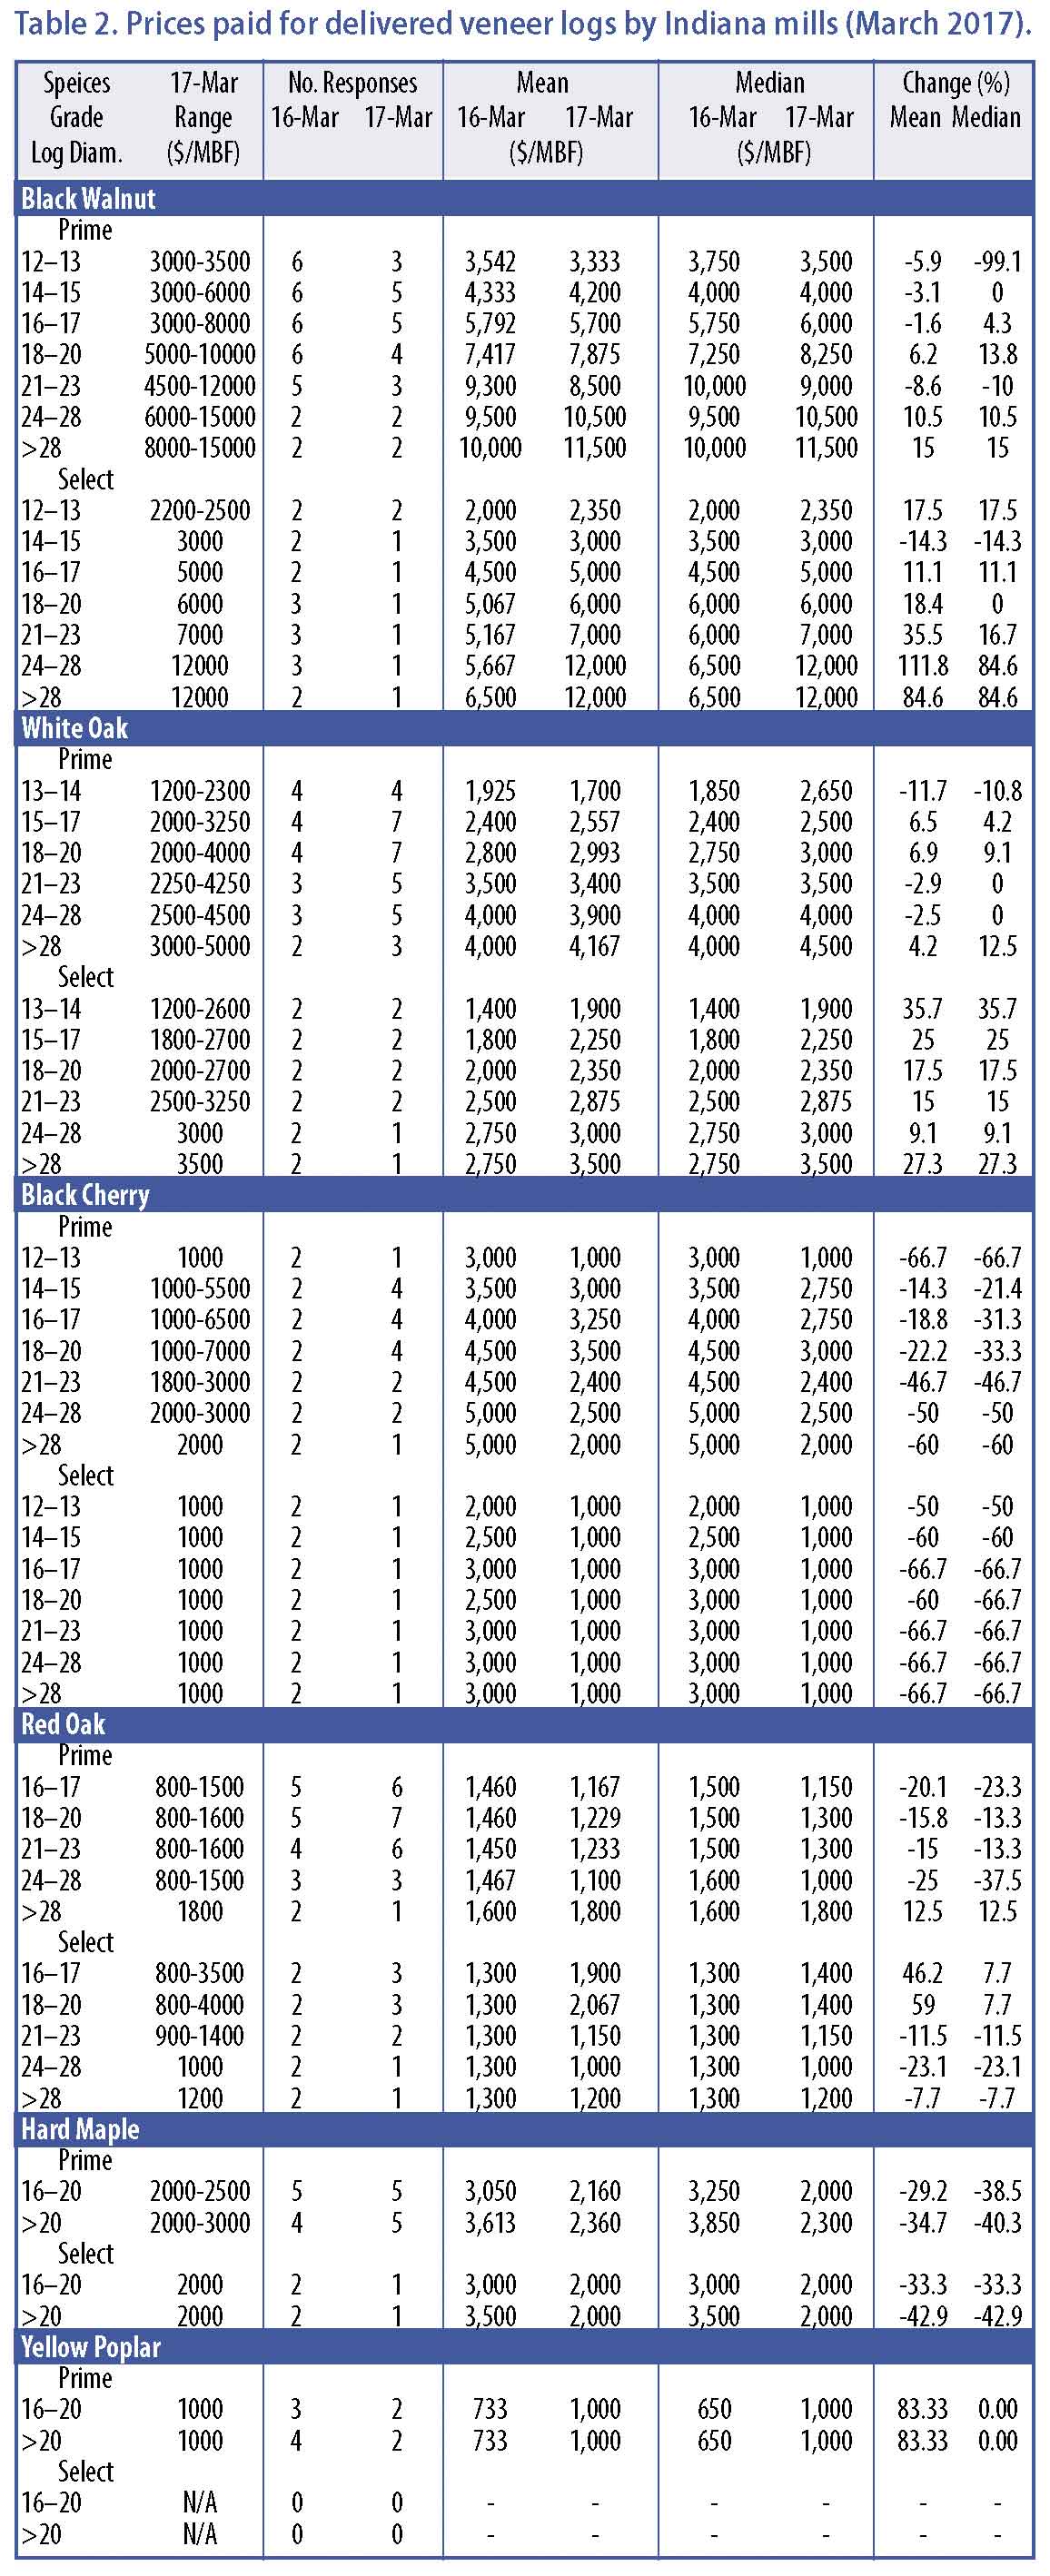
Softwood Logs
The price of pine sawlogs decreased very little (3%) to $277 MBF. Red cedar prices showed a significant gain of over 62% to $650 MBF. It should be noted however that only three producers reported pine sawlog prices and two producers reported red cedar prices.
Veneer Log Prices
The number of mills reporting veneer log prices decreased slightly from the 2016 spring report (Table 2). Prices were reported by both veneer mills and sawmills. Sawmills resell their veneer quality logs to veneer mills, exporters, overseas importers and manufactures. On occasion sawmills may produce specialty cuts like quarter sawn with the marginal veneer logs. The variation in veneer log pricing is due to a mix of veneer mills, sawmills and loggers reporting their values. This difference in values could be reduced if prices were only from veneer manufactures.
Market comments seem to be a mixed bag this spring as several report a really up and down marketplace. Walnut and white oak continue to experience good demand. Pricing remains very competitive from the export (especially China) side. The export log market has put a great deal of pressure on veneer mills as the international buyers are paying good prices for veneer logs. Several overseas companies are now buying North American veneer not being manufactured in the US but from companies processing US logs. The increased market share that wood lookalikes of plastic and vinyl is a major concern for the veneer business. Those manufactures can make the plastic and vinyl look exactly like wood with a cheaper price tag.
Black walnut and white oak veneer remain in demand both domestically and internationally. Black walnut veneer log prices were generally higher, especially prime in the larger diameter logs (24” +) which were around 12% higher than in the spring of 2016. Most all of the “select” grade walnut prices were higher. Keep in mind however that there were varied responses for the select grade logs.
White oak prime veneer log pricing was very close to what prices were in the spring of 2016. Prime grade white oak logs with a small end diameter of 15-20 showed the largest increase (almost 7%). Select white oak veneer logs were up significantly across all diameters.
Cherry veneer log markets are very slow and pricing reflected the sluggish markets with prices down significantly. Red oak prime veneer log prices were down an average of 13%, conversely, red oak select veneer logs were up an average of 13%. Veneer mills reported significantly lower prices for hard maple. Prime veneer hard maple logs were off almost 32% while select veneer logs were down an average of 27%.
Miscellaneous Products
The change in prices paid for or received for various raw-wood products between the spring 2016 report and the current report. (Table 3). These are lower quality and sometimes smaller logs purchased in batches of random species to be sawn into cants or chipped. The cants are re-sawn into boards used for pallets, blocking, railroad ties or other industrial applications that have a strong market. Some mills restrict purchases to specific species or exclude specific species, depending on the markets they sell to. The price for pallet and cant logs increased slightly. Bark prices were consistent with the 2016 spring report while sawdust prices were lower.
Until about the 1970’s sawdust, chips and bark would have been burned or landfilled by many mills. They now have many more uses. Sawdust can be used to make fuel pellets, burned as a heating source, or used as animal bedding. Wood chips are produced primarily from slabs sawn off of debarked logs. The decline in the pulp and paper industry is a threat to this market. Bark used for landscape mulch is now a large market. In some facilities all or some portion of these byproducts are used to fire efficient low-emission boilers to heat dry kilns year round and heat facilities in the winter. Attempts have been made to cogenerate electricity at mills, standalone generating plants, and biofuel. Success has been limited by the low cost of electricity purchased off of the grid, below cost price received if sold into the grid, and the high cost to produce biofuels.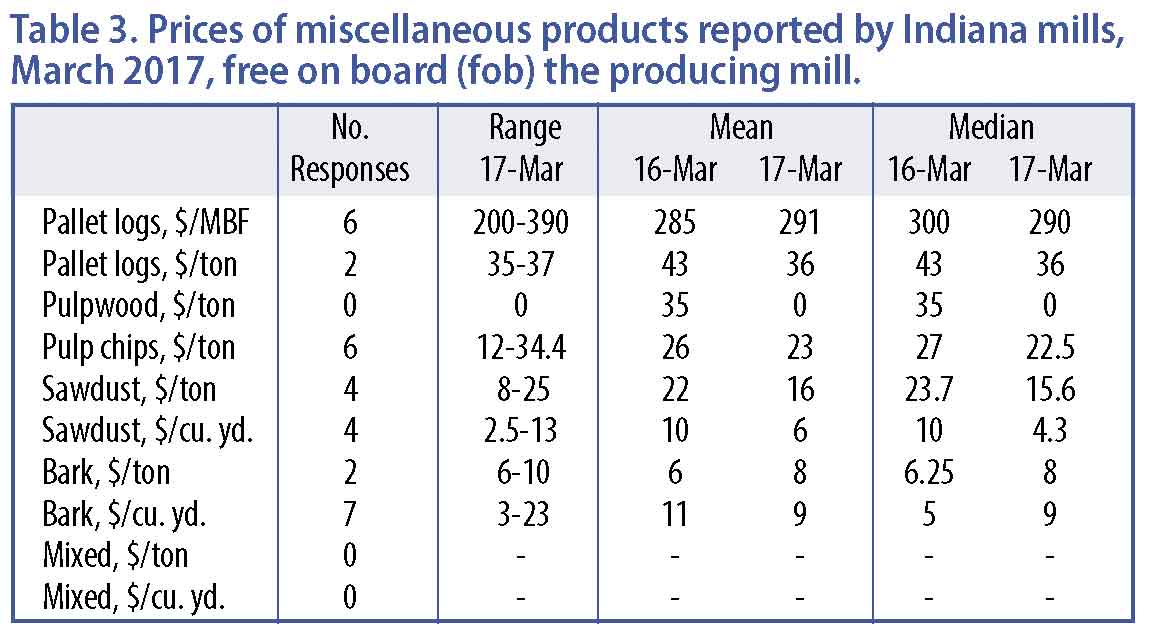
Custom Costs
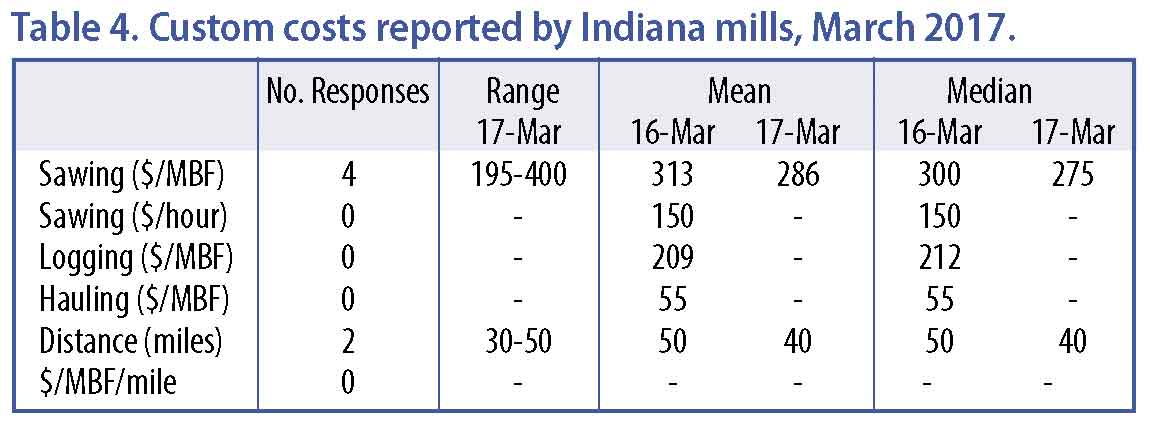
Costs of custom services increased from the spring report in the areas of sawing and logging (per/MBF). The high cost of diesel fuel usually plays a large role in logging costs as well as sale layout and costs to close out sales implementing Best Management Practices (BMPs) (Table 4). There were no surveys returned with logging and hauling costs. However, we feel those costs are generally around $200-220 MBF.
 Indiana Timber Price Index
The delivered log prices collected in the Indiana Forest Products Price Survey are used to calculate the delivered log value of typical stands of timber. This provides trend-line information that can be used to monitor long-term prices for timber. The species and log quality weights used to calculate the index are described in previous editions of this report. The weights are based primarily on the 1967 Forest Survey of Indiana with changes made to remove basswood, cottonwood, elm, black oak and sycamore in 2014.
The nominal (not deflated) price is a weighted average of the delivered log prices reported in the price survey. The real prices are the nominal prices deflated by the producer price index for finished goods, with 1982 as the base year. The real price series represents the purchasing power of dollars based on a 1982 market basket of finished producer goods. It is this real price trend that is important for evaluating long-term investments like timber and the log input cost of mills. Receiving a rate of return less than the inflation rate means that the timber owner is losing purchasing power, a negative real rate of return.
Note that each year the previous year’s number is recalculated using the producer price index for finished goods for the entire year. The price index used for the current year is the last one reported for the month when the analysis is conducted: March this year. The index increased slightly from 1.83 for 2016 to 1.91 as of March 2017. Inflation in the 1 to 2 percent range is generally considered a sign of a healthy, growing economy. The change from 2016 to 2017 is about 2 percent.
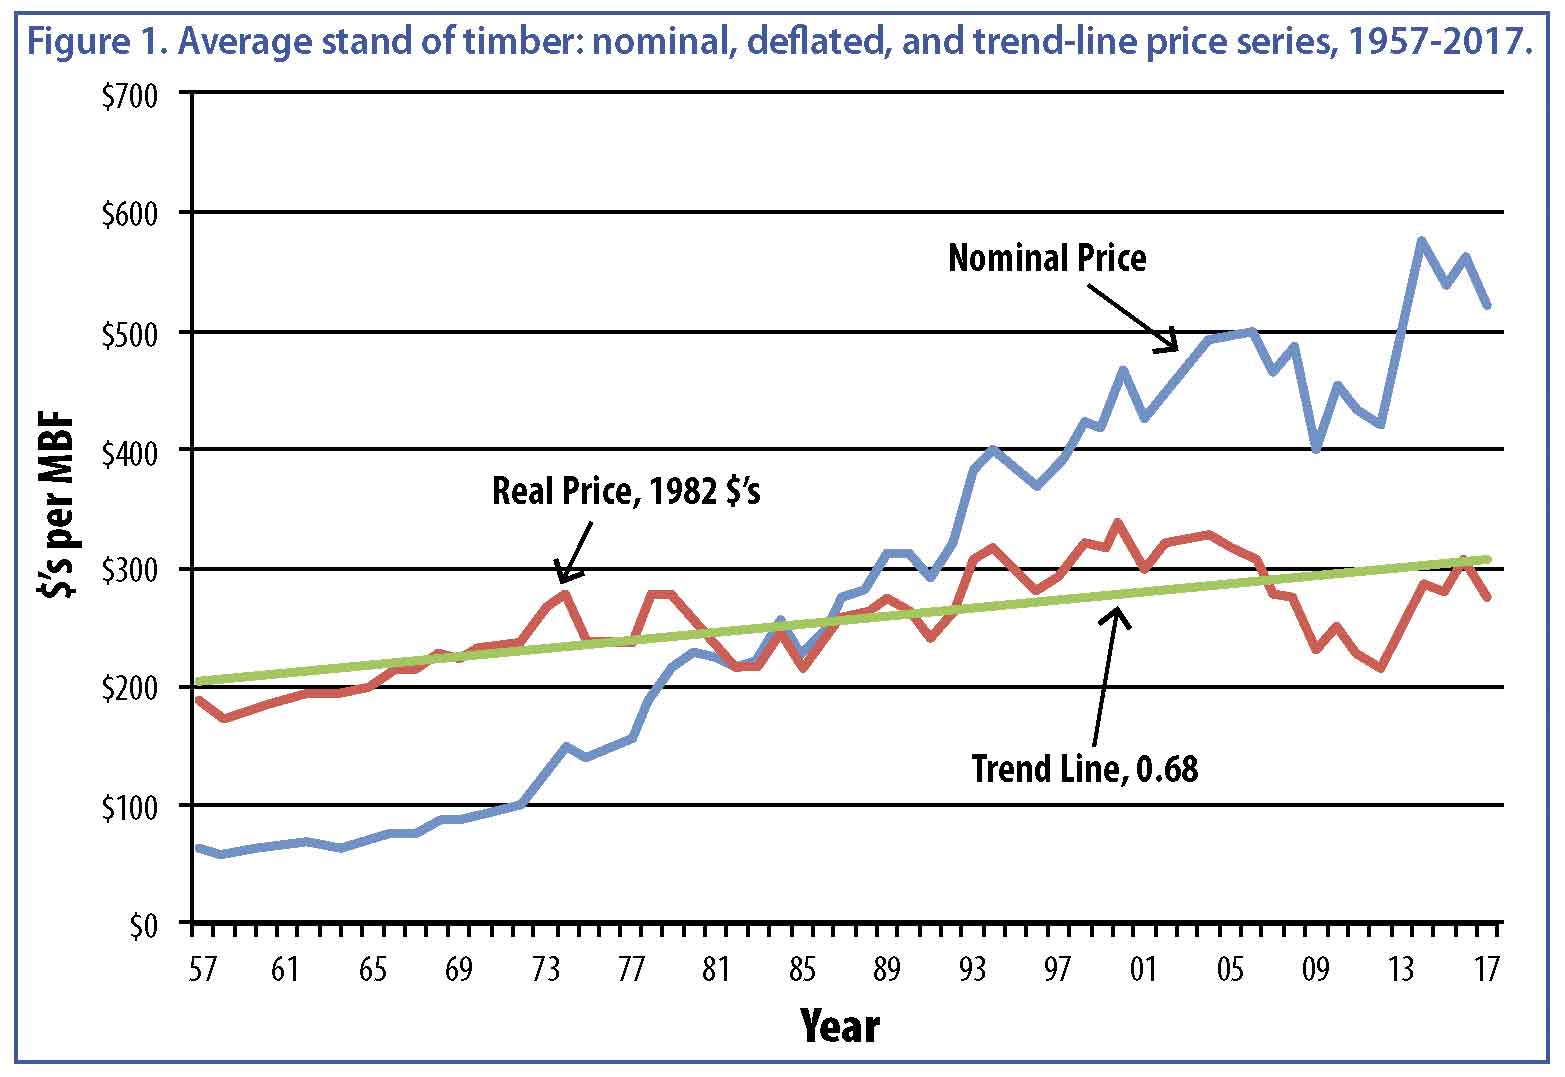
Average Stand
The nominal weighted average price for a stand of average quality decreased from $559.0 in 2016 to $519.7 this year. Again, this series is based on delivered log prices, not stumpage prices. The deflated, or real price decreased from $306.5 in 2016 to $271.69 this year. The average annual compound rate of interest required to take the linear trend line from $201 in 1957 to $271.69 in 2017 is .68 percent; compare the green trend line with the red real price line in Figure 1.
 Quality Stand
The nominal weighted average price for a high-quality stand decreased from $822.7 in 2016 to $783.3 this year. The average real price series for a high-quality stand decreased from $451.0 in 2016 to $409.5 this year. The average annual compound rate of increase for the trend line is 0.98% per year (Figure 2).
Implications
The extent to which holding a stand of timber increases purchasing power depends on when you take ownership and when you liquidate. The 61-year period used in this analysis is much longer than the typical length of ownership. The rate of increase in the trend line does not include the return resulting from increase in volume per acre by physical growth, nor the potential increase in unit price as trees get larger in diameter and increase in quality. Maximizing these increases in value requires timber management.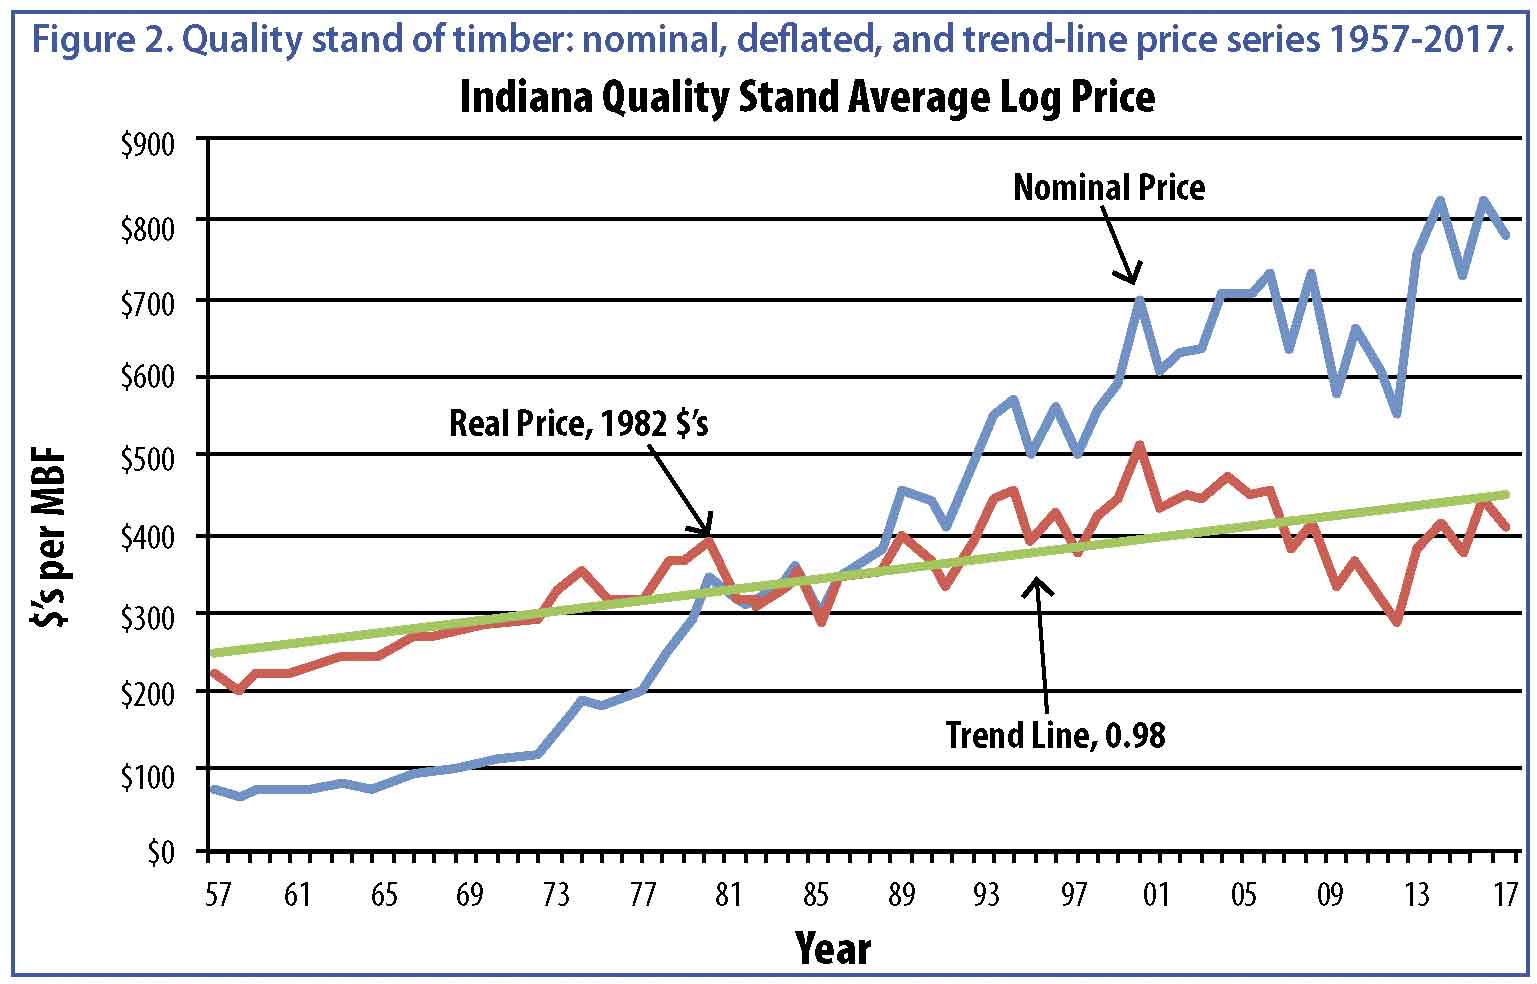
The complete 2016 Indiana Forest Products Price Report and Trend Analysis can be read in its entirety at: http://www.in.gov/dnr/forestry/. Previous reports are available online through the Purdue University Library, www.lib.purdue.edu.
Jeffrey Settle, Forest Resource Information (FRI); Chris Gonso, Ecosystem Services Specialist for the Indiana Department of Natural Resources, Division of Forestry; and Mike Seidl, Hardwoods Program Manager for the Indiana State Department of Agriculture